List of trades representation

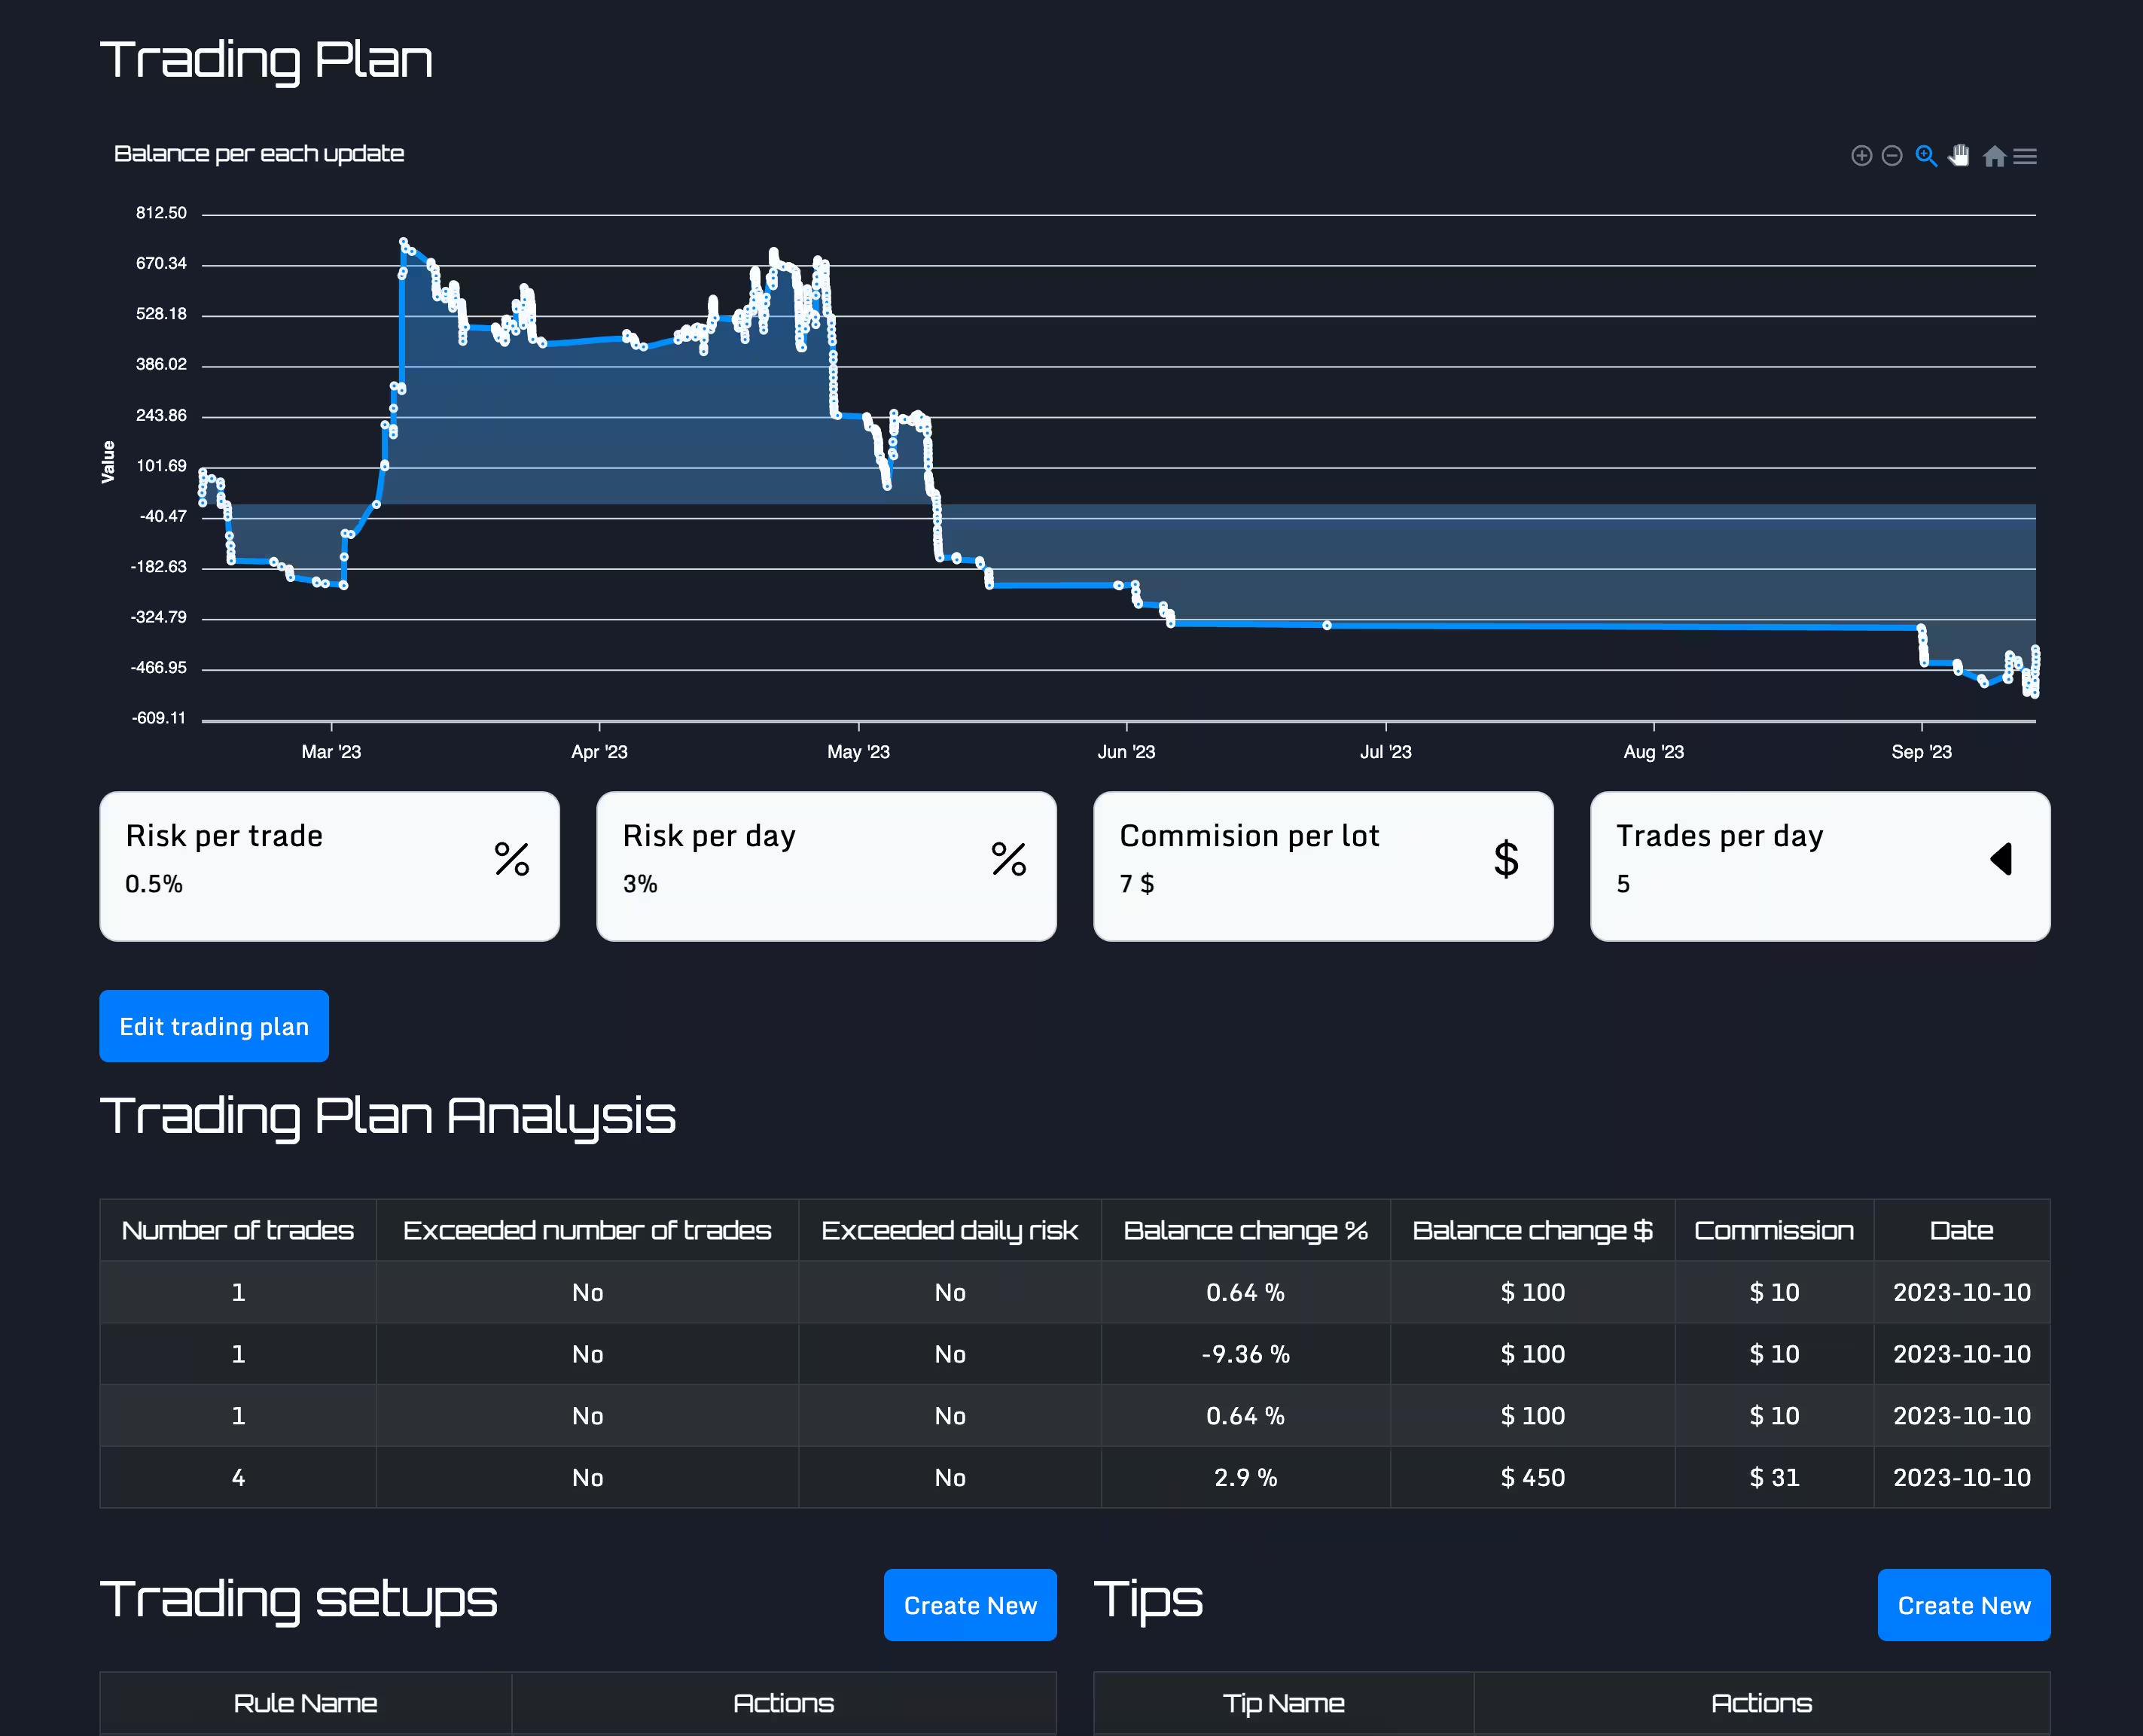
Trading plan

  • Trading setups
  • Risk per Trade/Day
  • Number of trades per day
  • Track everyday if you followed trading plan
  • Add Tips to folow the plan
  • Track balance progress

Your Trading Dashboard

The Epicenter of Your Trading Journey.

Step into a world where every trading move you make gets crystallized into data-driven insights. Your dashboard isn't just a reflection of your trades; it's a narrative of your trading journey.

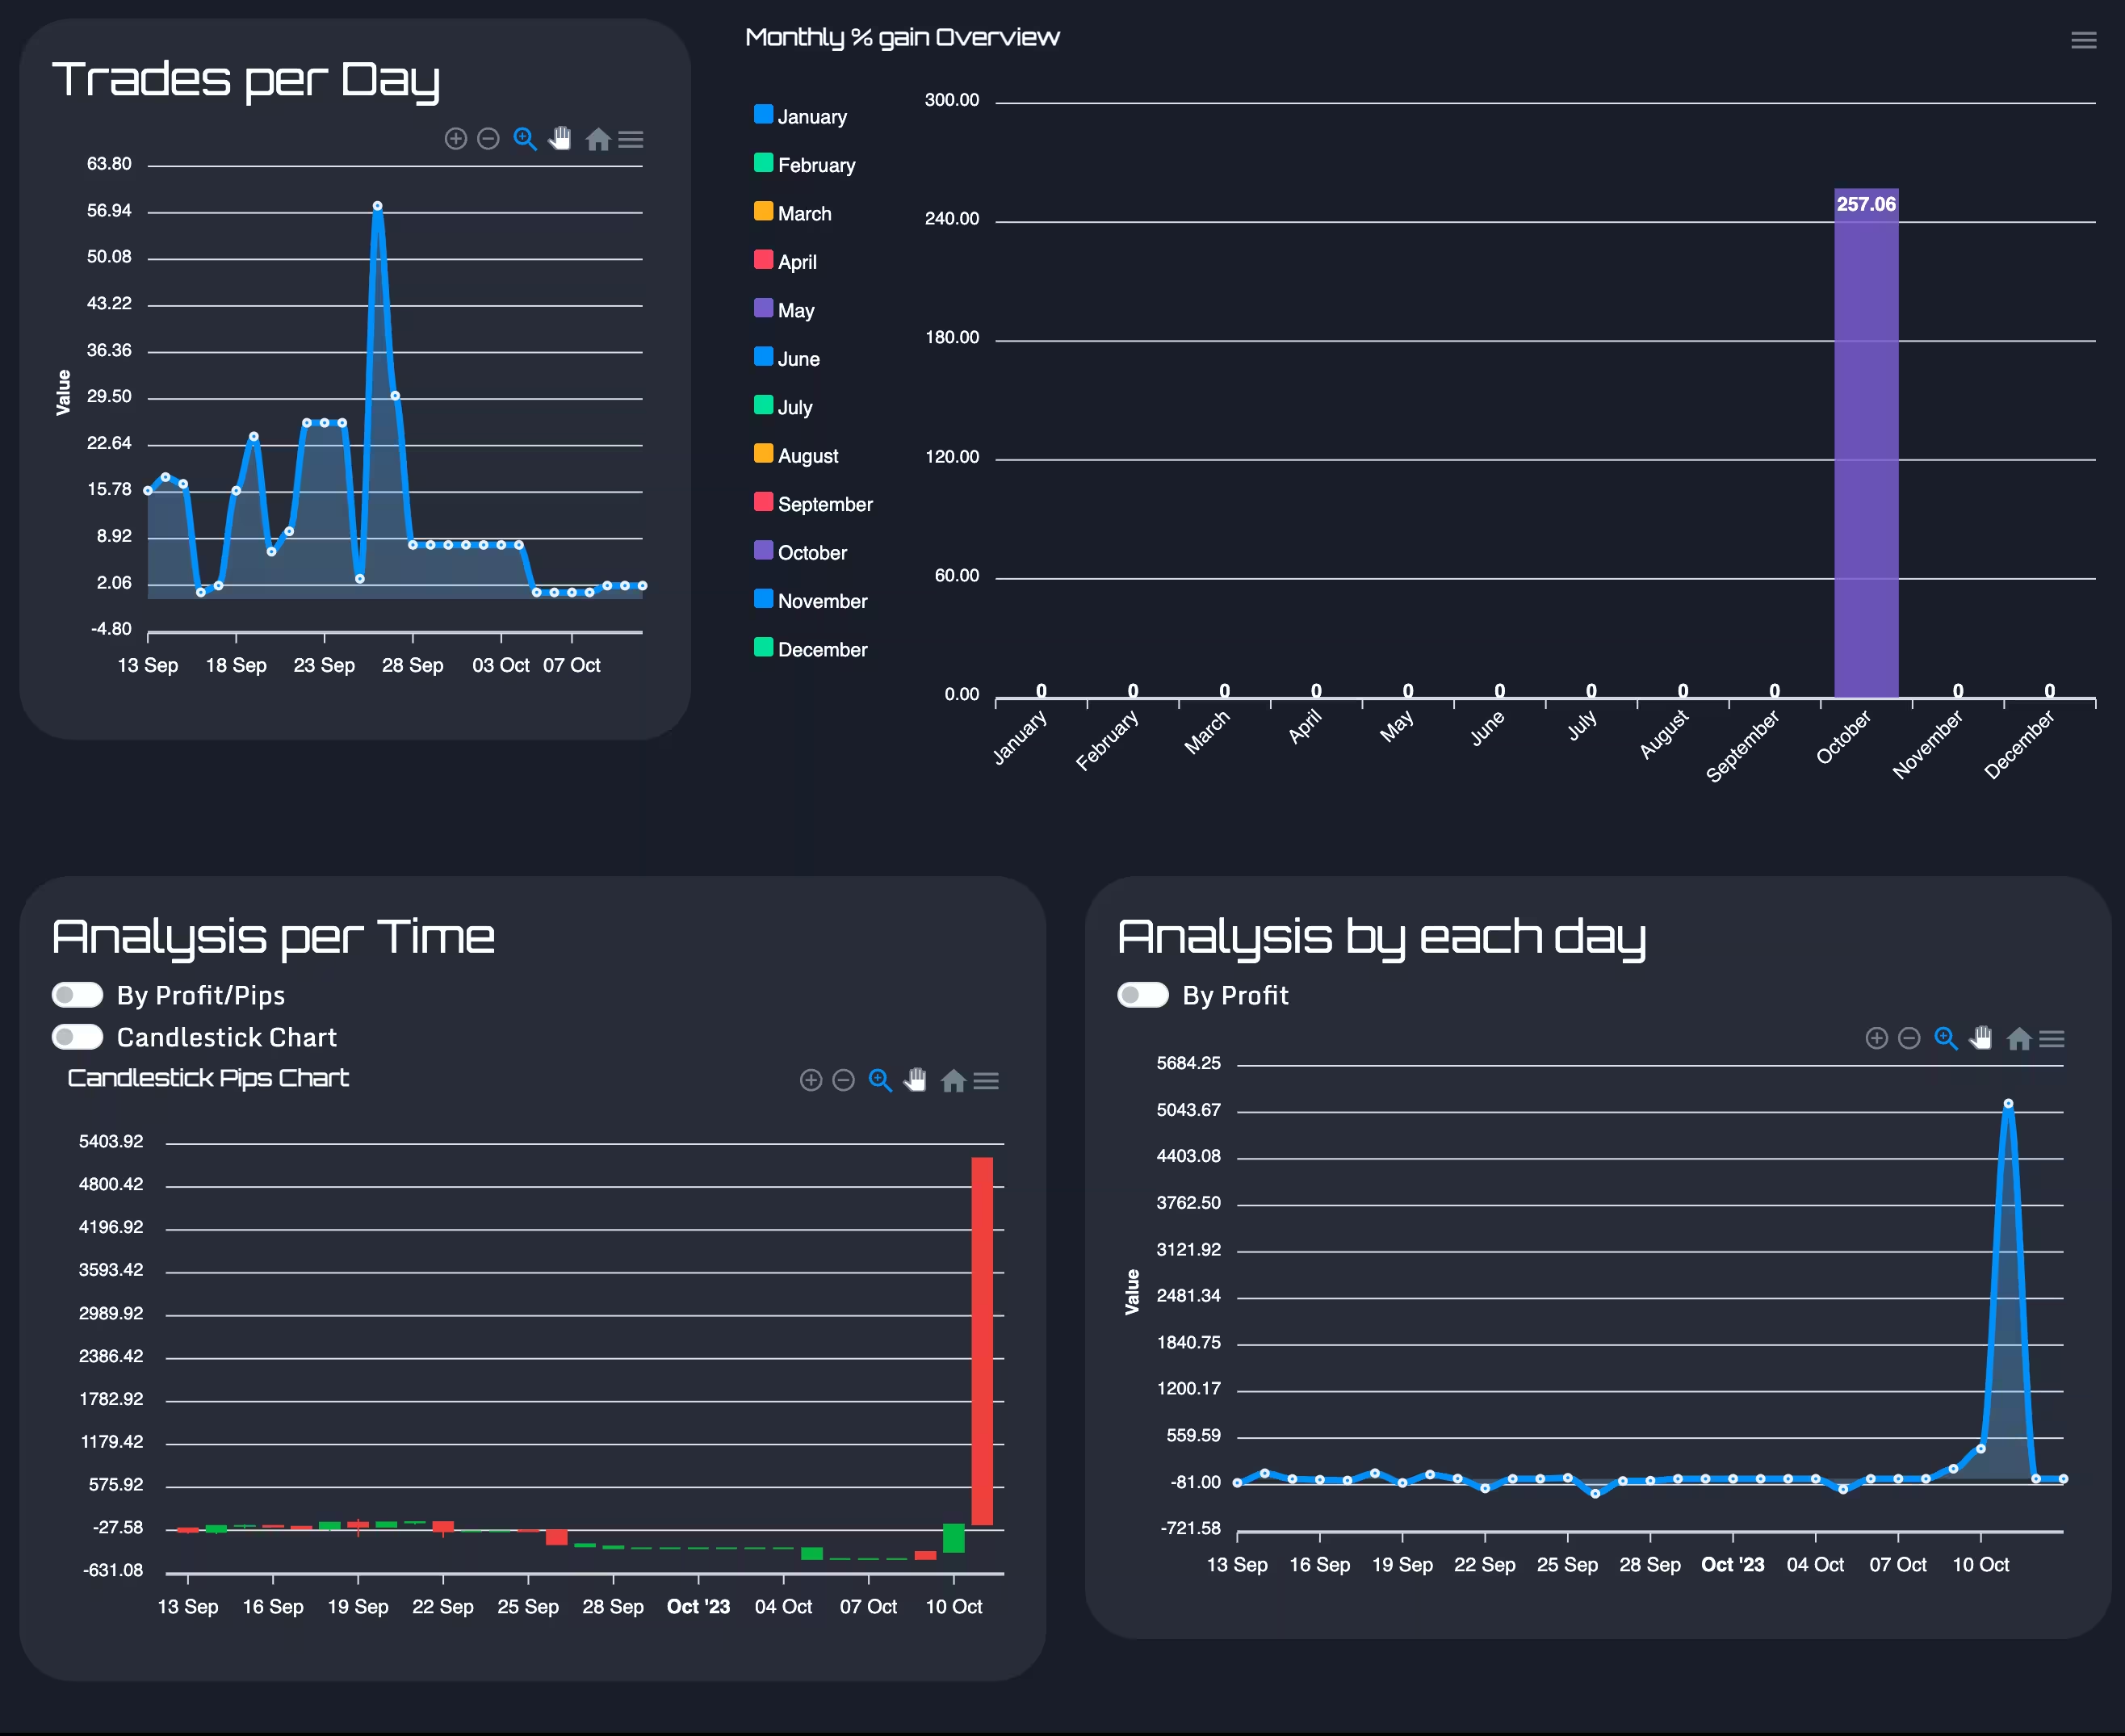
  • Trade Trajectories: Visualize your daily trade numbers and watch your profit and pips dance in sync, painting a story over time.
  • Progress Pulse: With line and candlestick charts, see if you're climbing the trading ladder or need to reevaluate.
  • Monthly Metrics: Capture monthly surges or slumps with % balance changes. Make every month count.
  • Trade Tidbits: From your biggest triumphs to lessons learned, track every win, loss, and that most-traded pair.
  • Detailed Diagnostics: Dive deep with win rates by pair, buy-sell ratios, and an overarching view of your trading prowess.
  • Instant Insights: Get a quick snapshot of your % gains, total trades, pips, and win ratio - be it today, this week, or the entire month.

Your dashboard is more than numbers; it's a chronicle of your trading evolution. Embrace it.
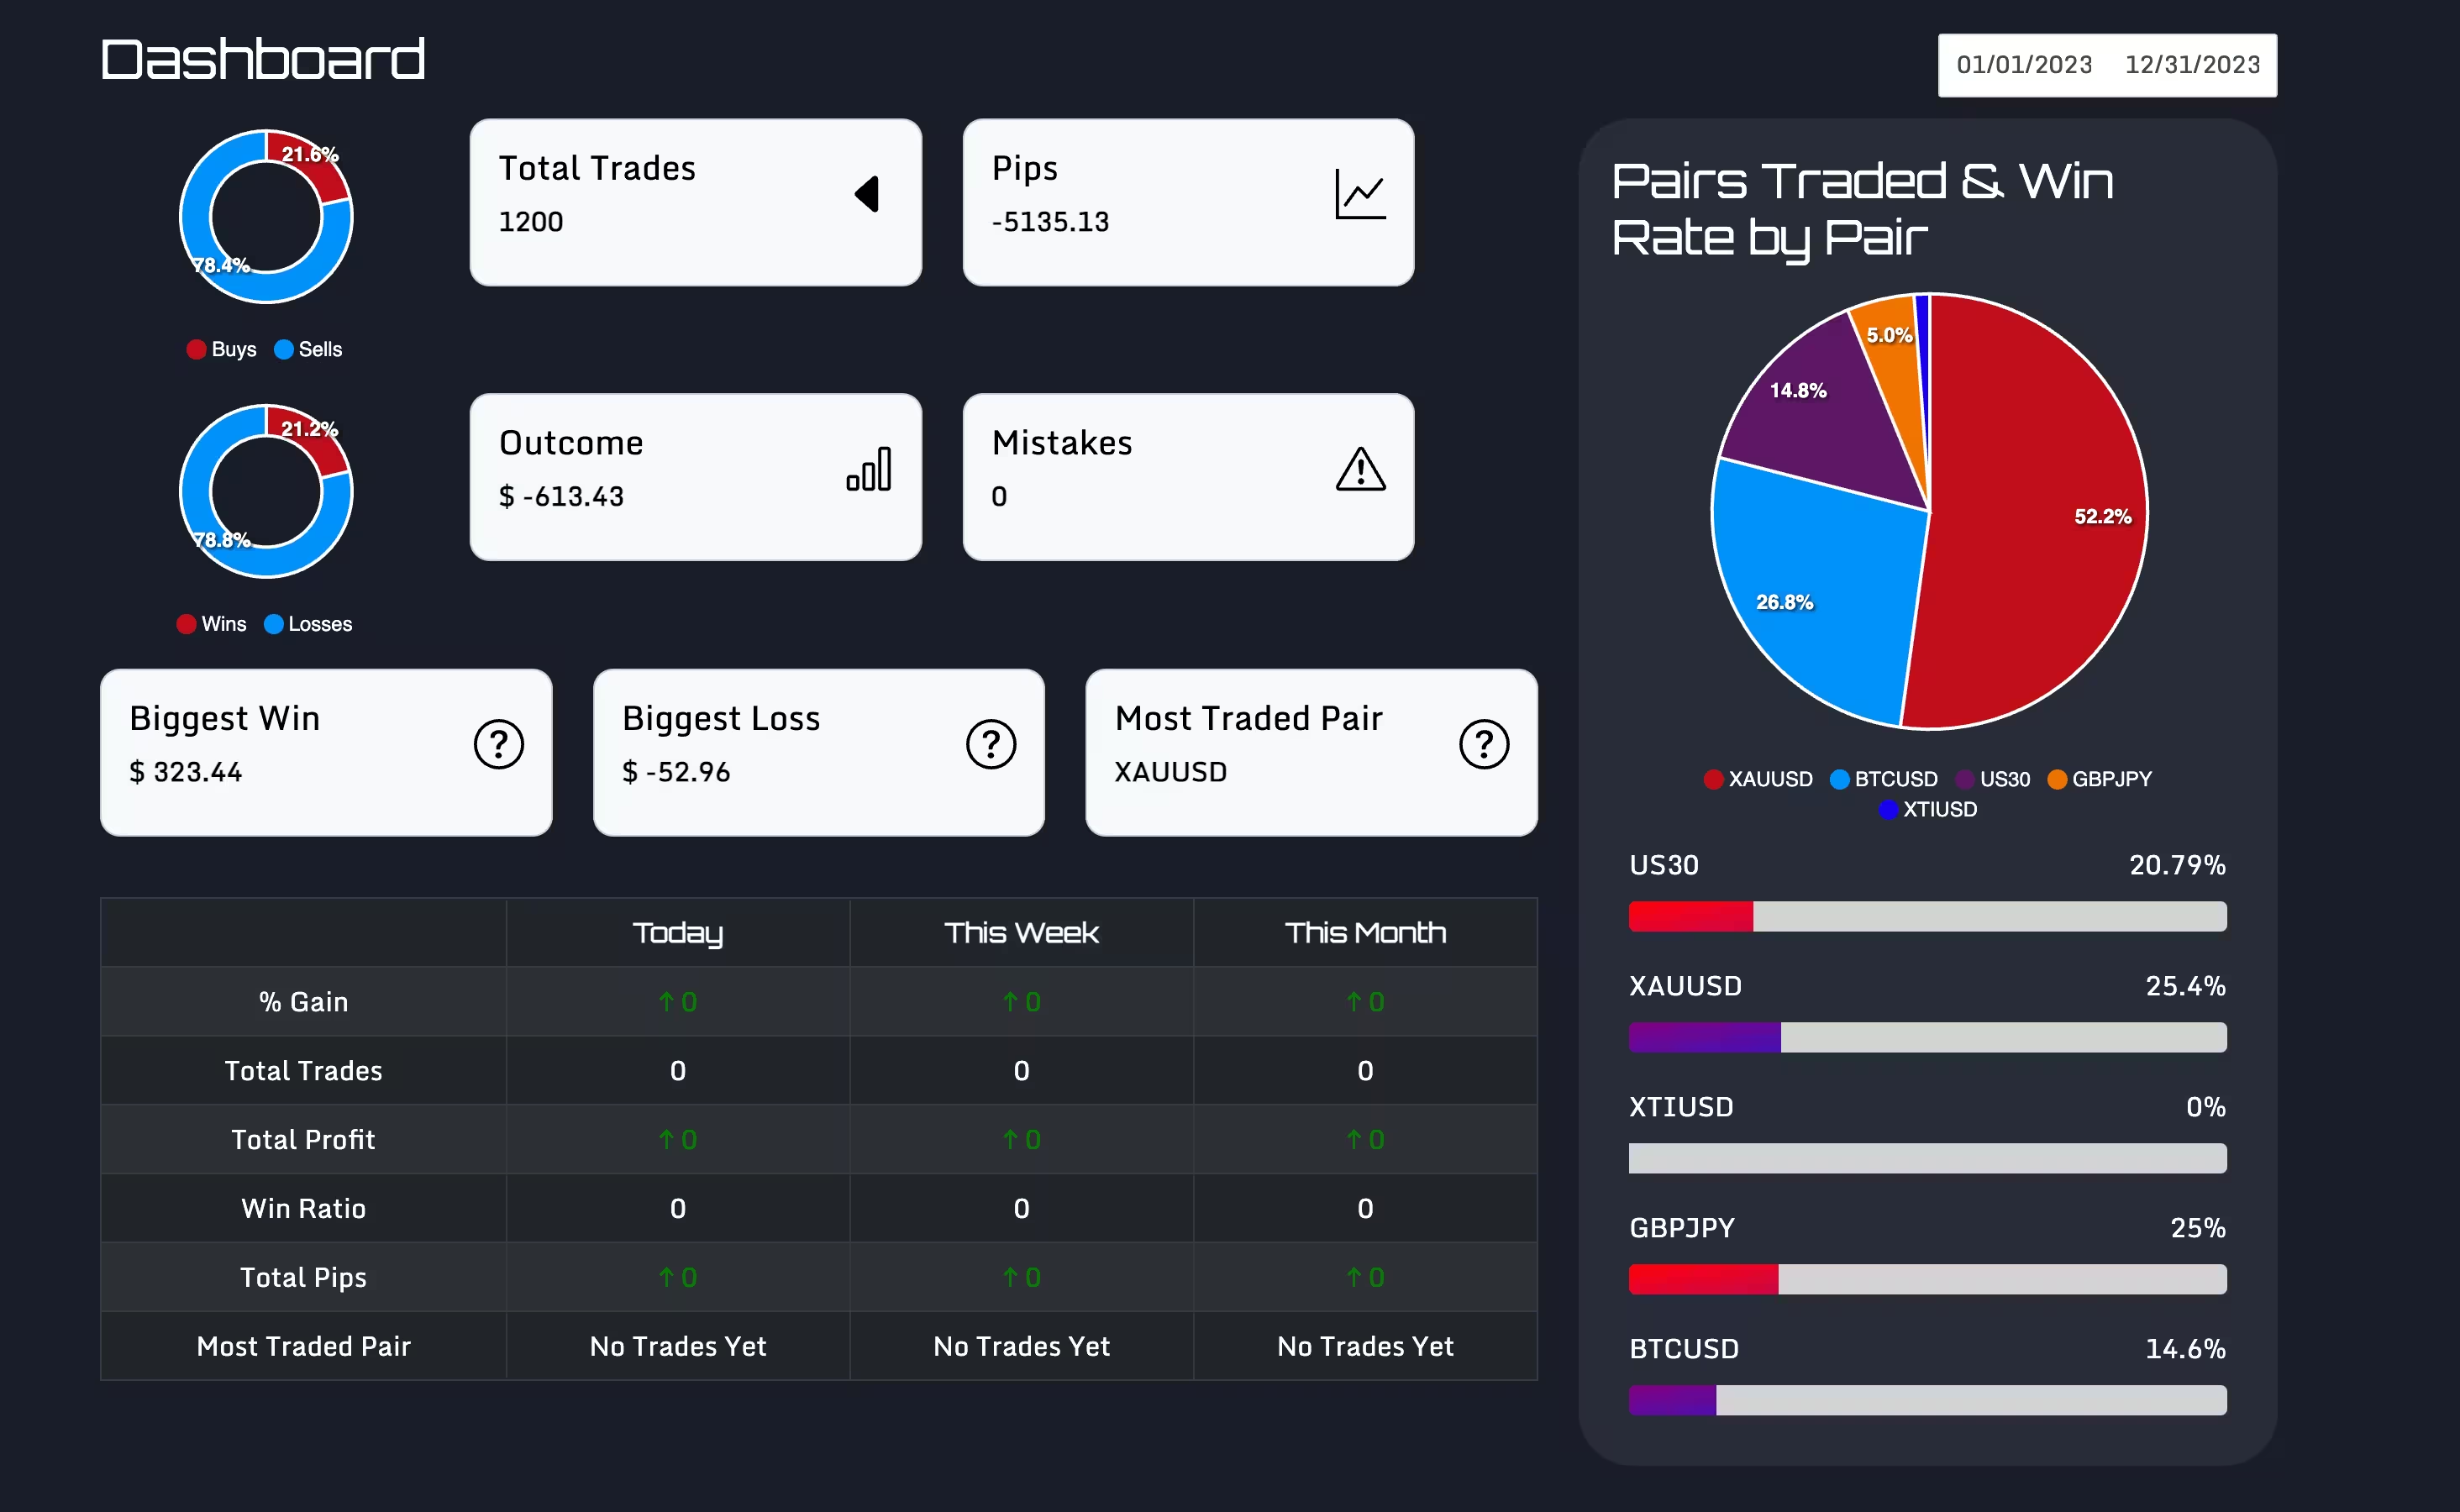
Graphical representation of trading insights and progress
Analytical breakdown of trading metrics

Empower Every Trade With Knowledge

Your trading choices, decoded. With an arsenal of analytics at your fingertips, refine your strategies, mitigate missteps, and amplify your successes. Welcome to informed trading.
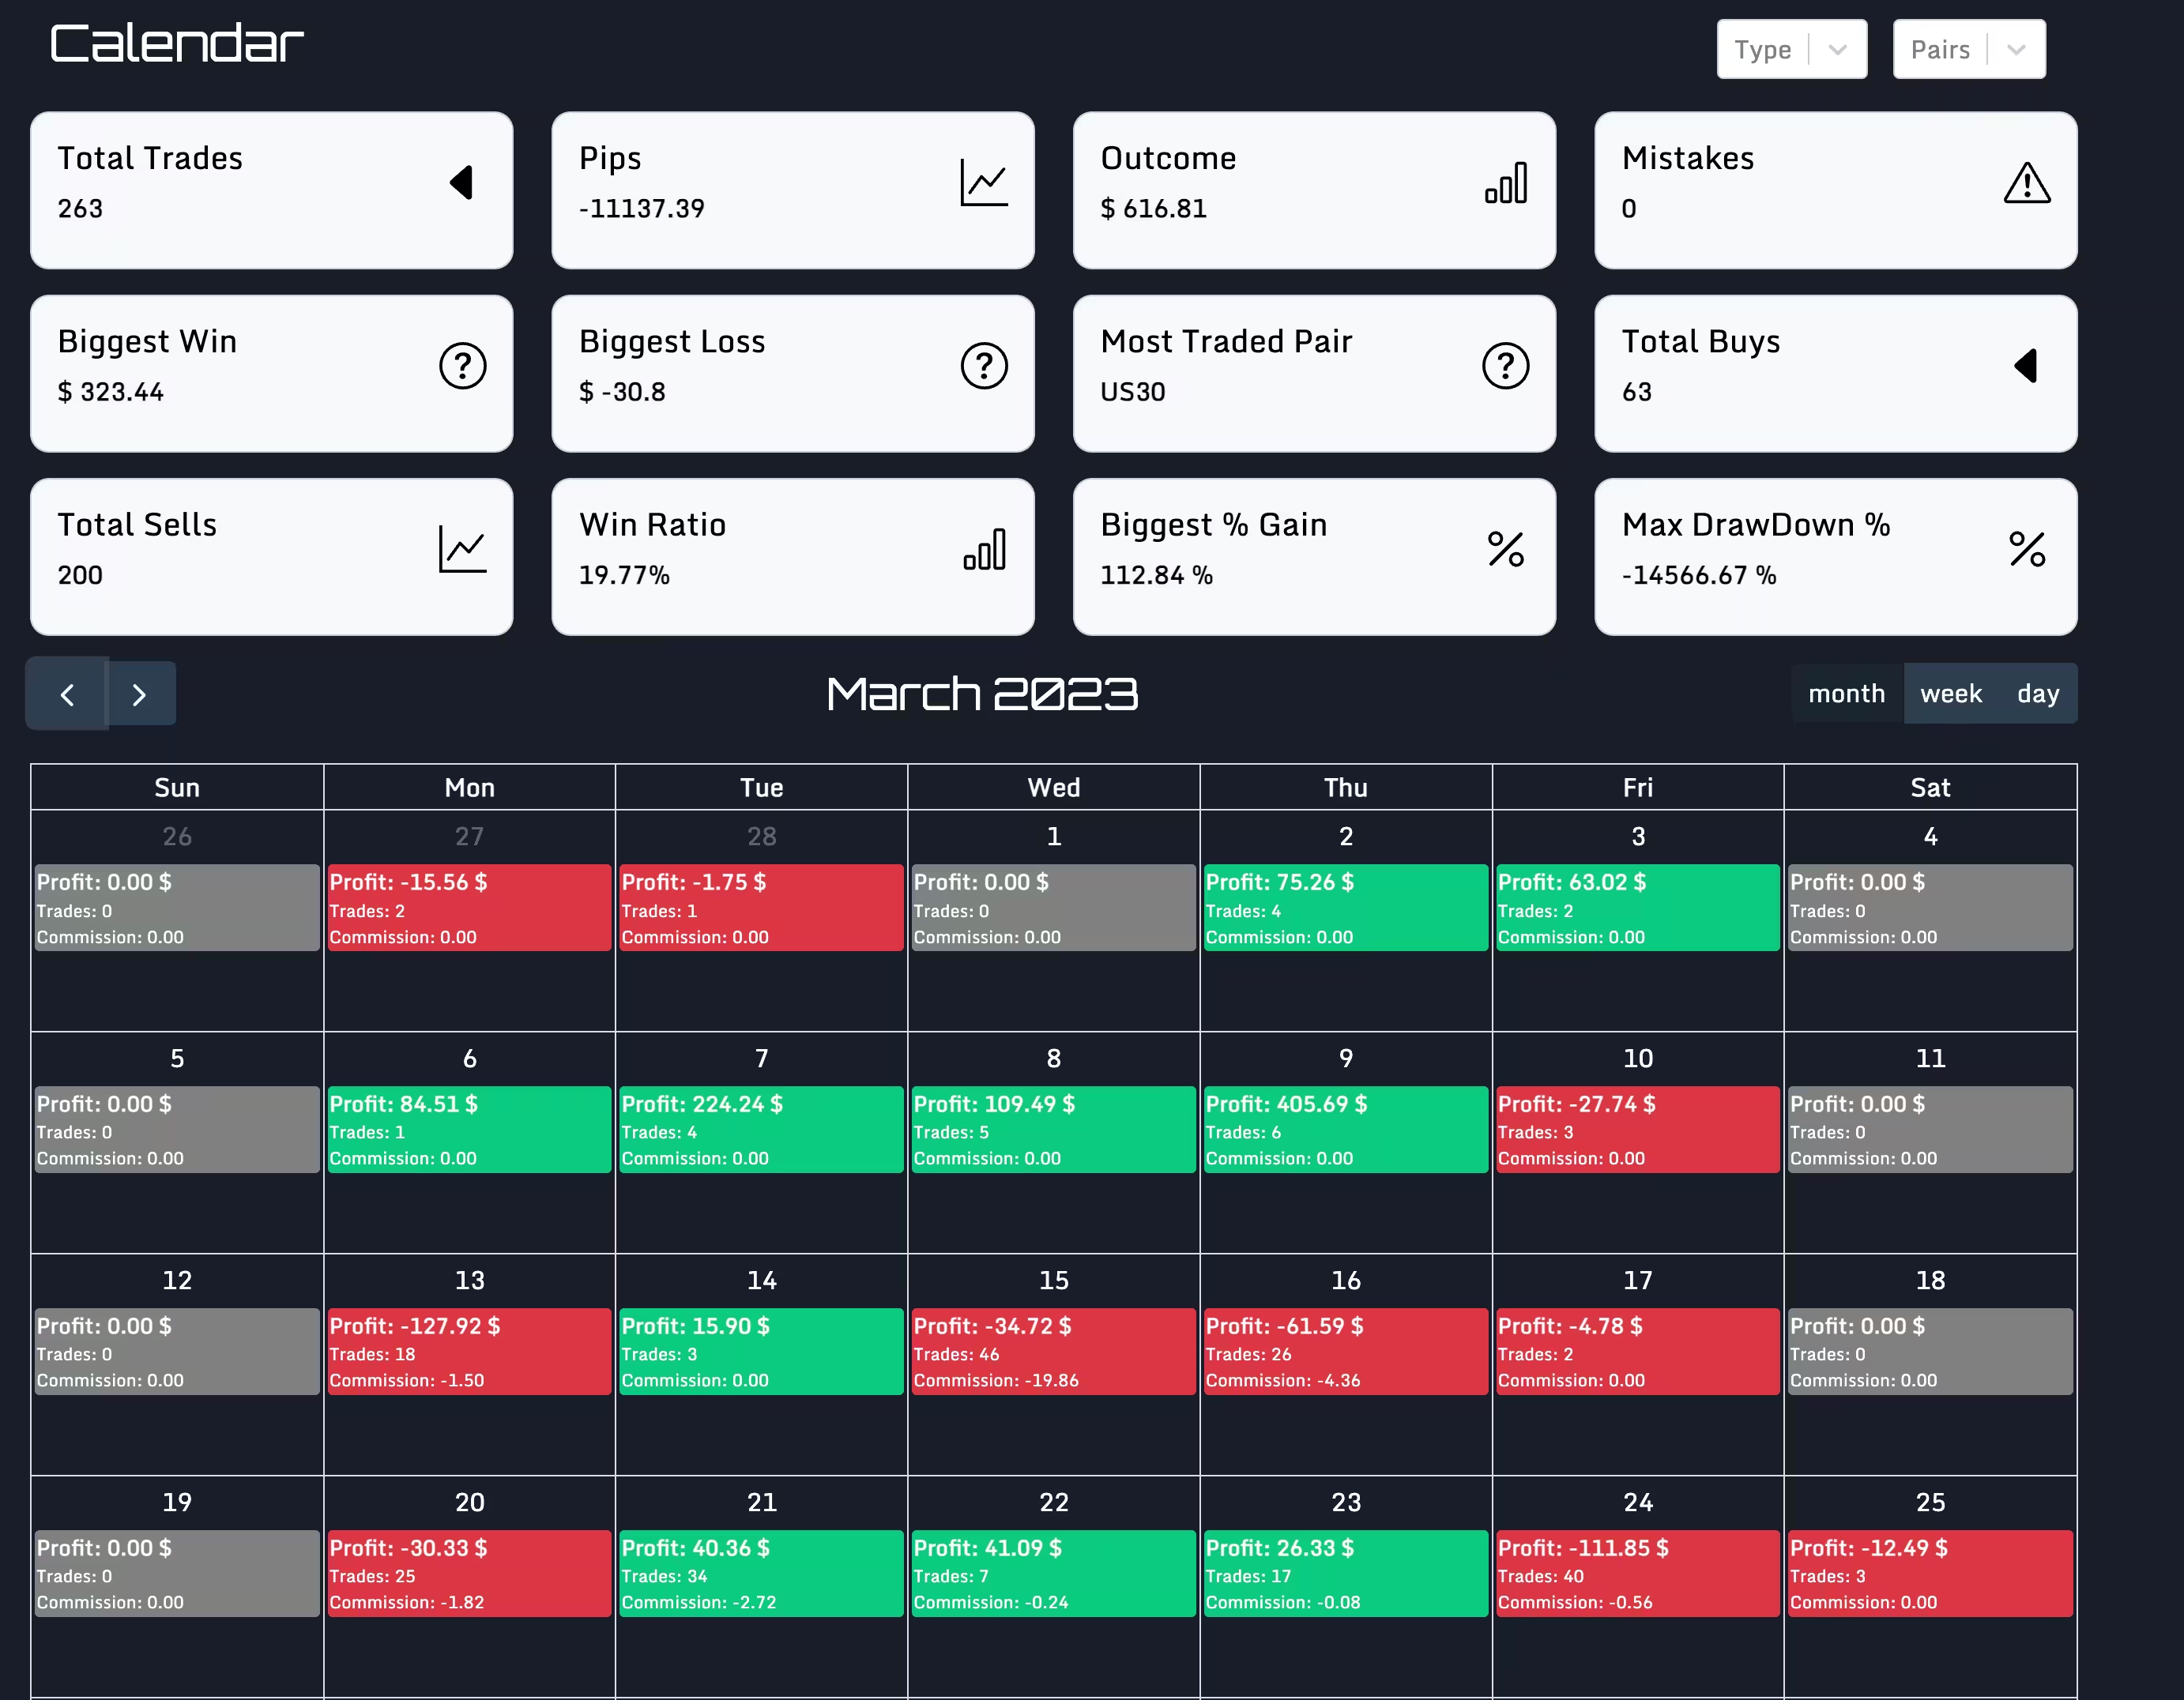
Calendar view representation

Trade Calendar

Visualize Your Trading Journey, Day by Day.

Get an instant visual summary of your daily trading performance. Green or red, profit or loss, every day tells a story.

Performance Snapshot: At a glance, know if your day was profitable or not. Simple color codes make it easier to interpret.

Trade Details: From summed commissions to the exact number of trades, dive deep into the specifics of each day.

Filter and Focus: Sort your view by trading pairs or by type (buy/sell) to glean insights specific to your query.

Monthly Metrics: Above your daily insights, find cards detailing your monthly performance – total trades, pips, outcomes, key mistakes, and even your biggest wins or losses.

Every day brings lessons. What story does your calendar tell?
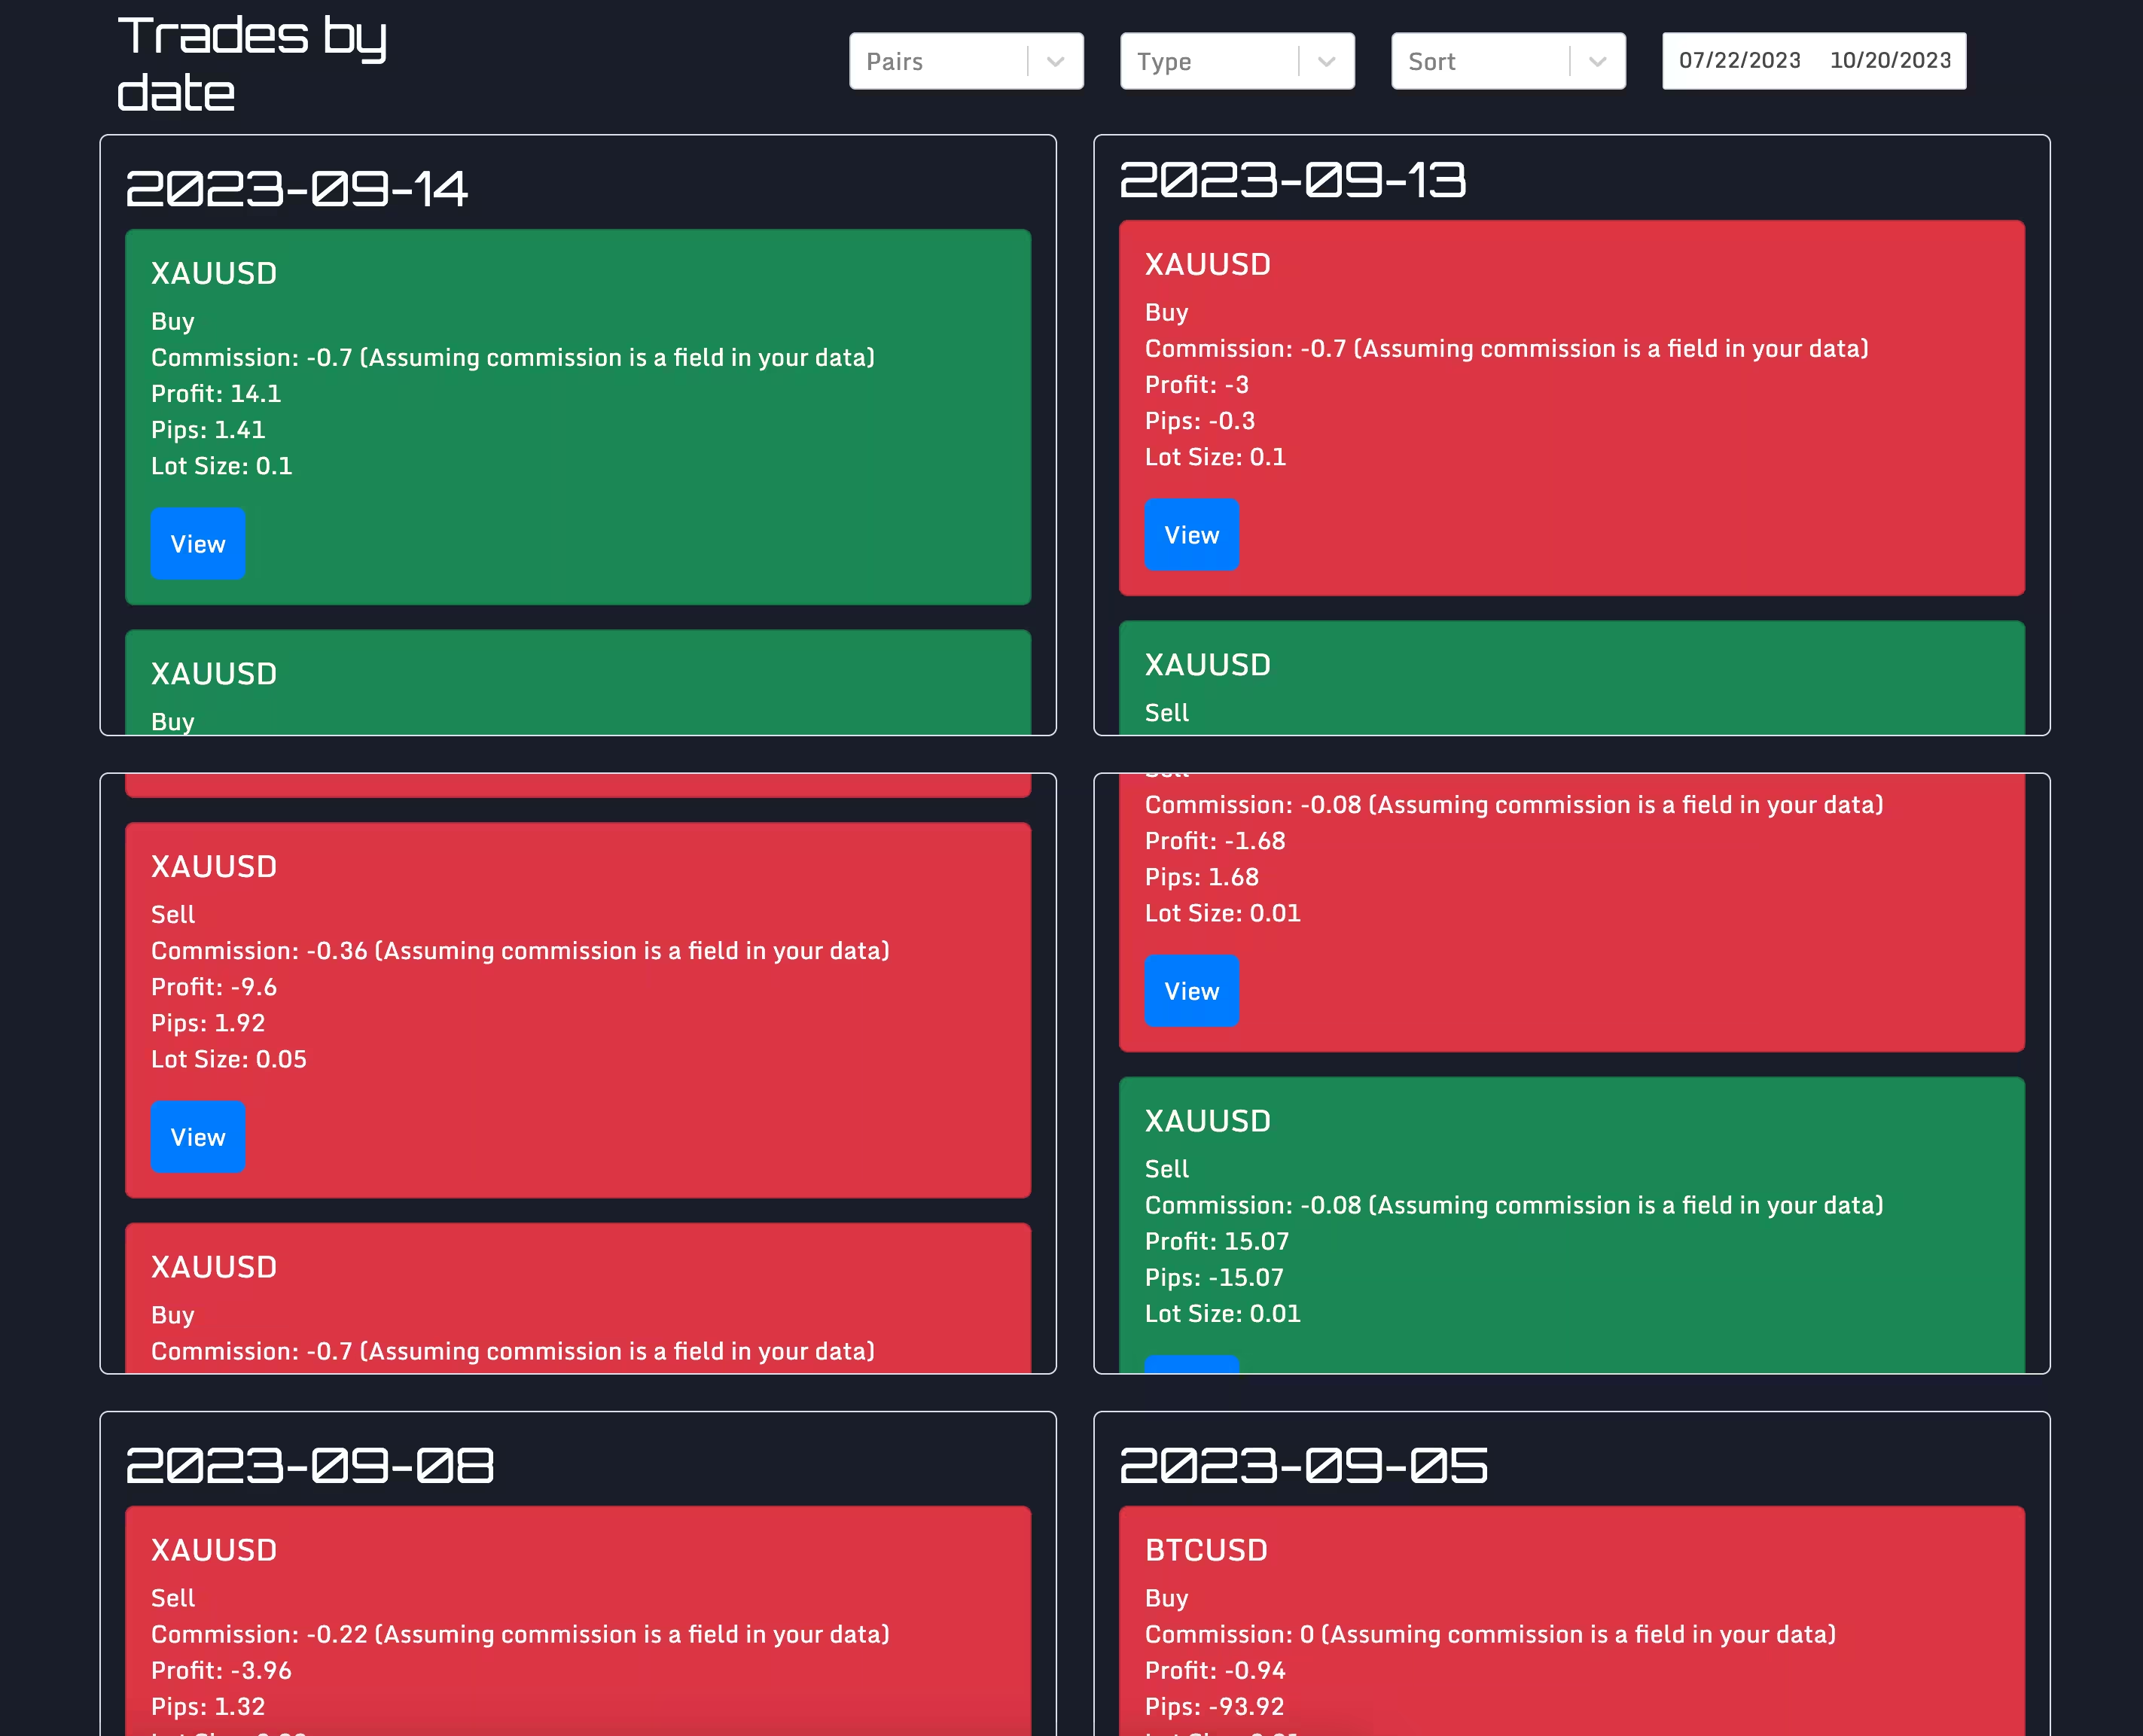
List of trades representation

Trade Date Directory

Every Date, Every Trade, All in One Place.

Navigate your trading history with precision. Our directory enlists every date you made a trade, allowing you to revisit and review.

Color-Coded Insights: With just a glance, know which trades hit the mark and which ones missed, thanks to our intuitive green and red indicators.

Trade Specifics: Click on a date, and the trades for that day unfurl before you, detailed and easy to digest.

Personalized Filtering: Whether you want to see trades for specific pairs or types (buy/sell), our filters have got you covered.

Learn from History: With easy access to past trades, you're equipped to analyze, adapt, and improve your future strategies.

Because understanding yesterday's trades can pave the way for tomorrow's successes.
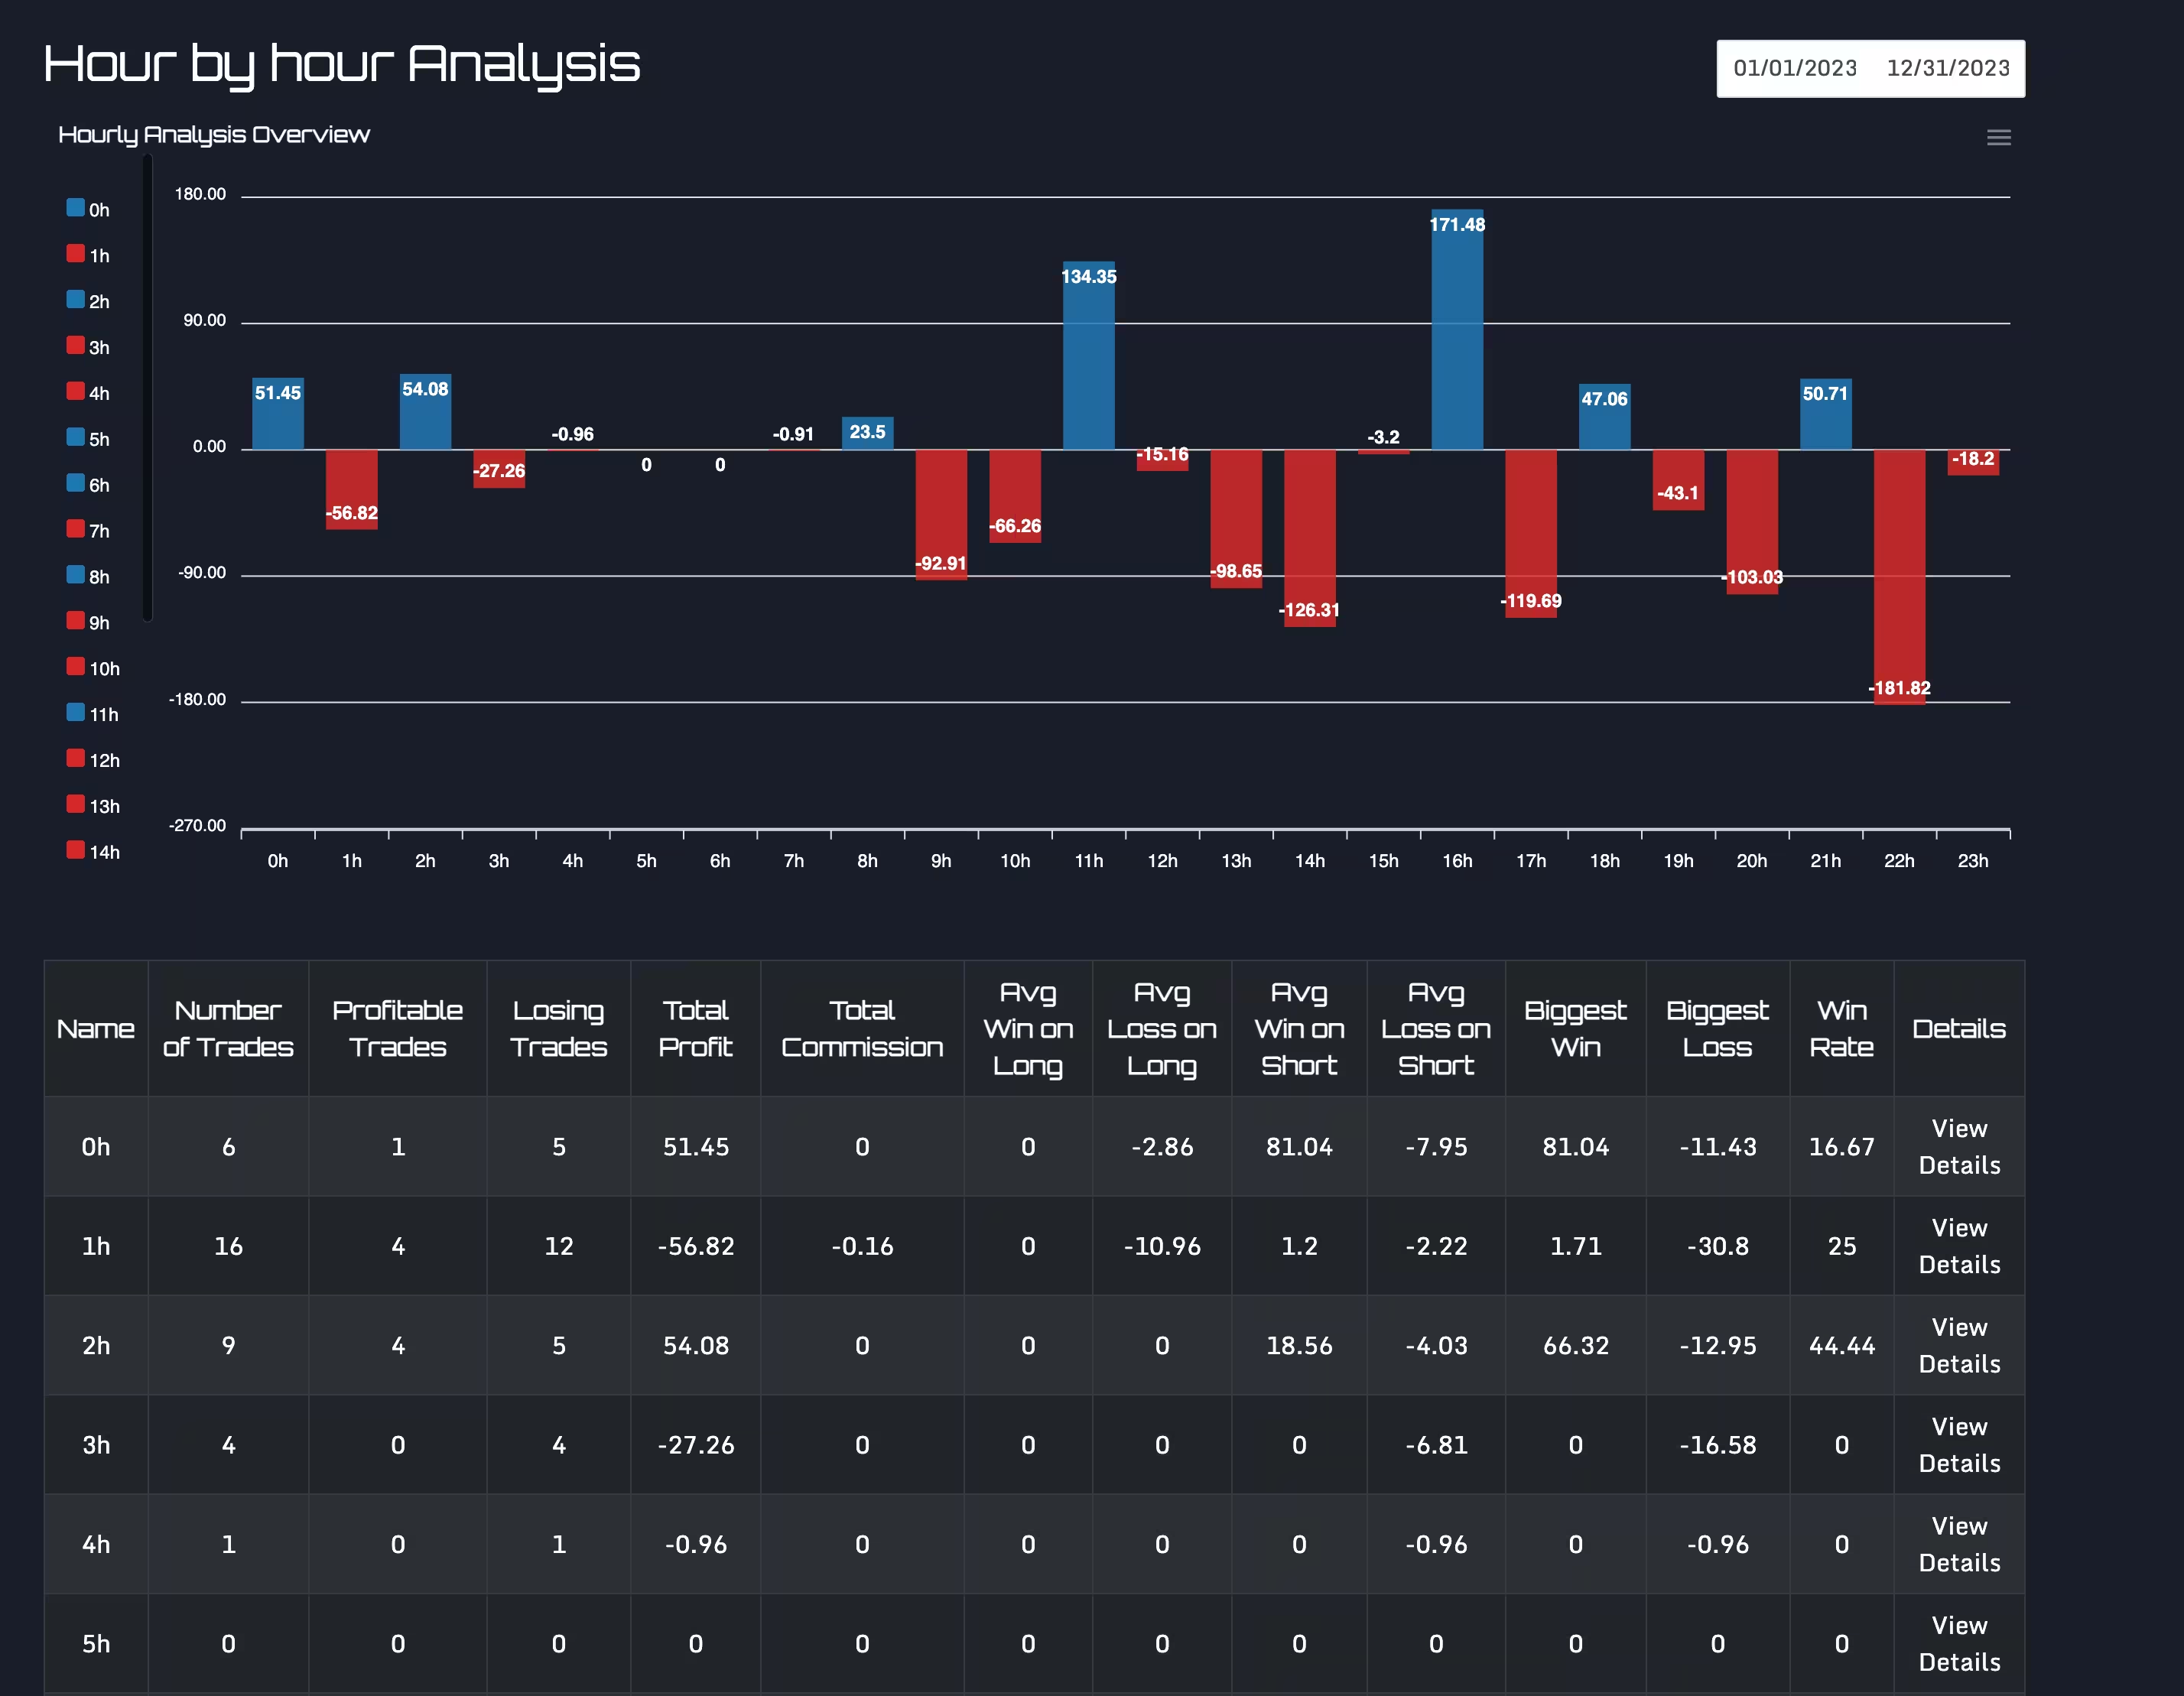
Graphical representation of reports

Comprehensive Trading Reports

From Hours to Months: Analyze Every Facet of Your Trades.

Dive into granular insights with our advanced reports, tailored to provide a holistic view of your trading patterns.

  • Time-Based Analysis: Evaluate your trades by hours, days, months, or hold time.
  • Pair Performance: Discover which pairs are your strongest and weakest links.
  • Visual Metrics: Grasp your performance through intuitive graphs showcasing profits over specific periods.
  • Deep Dive Profiles: Click on any time unit or pair to get a detailed profile, complete with win/loss rates, profit charts, and more.
  • Performance Insights: Understand your trading temperament with metrics like winning streaks, drawdown, biggest wins/losses, and overall win rate.

With our reports, not only do you get a window into your past trades, but you also gain actionable insights to refine your future strategies.

Seamless Integration with Tabular Insights

Below the graphical reports, find a detailed table listing all hours, days, months, hold times, and pairs. This integration ensures you're never more than a click away from an in-depth analysis of any metric.
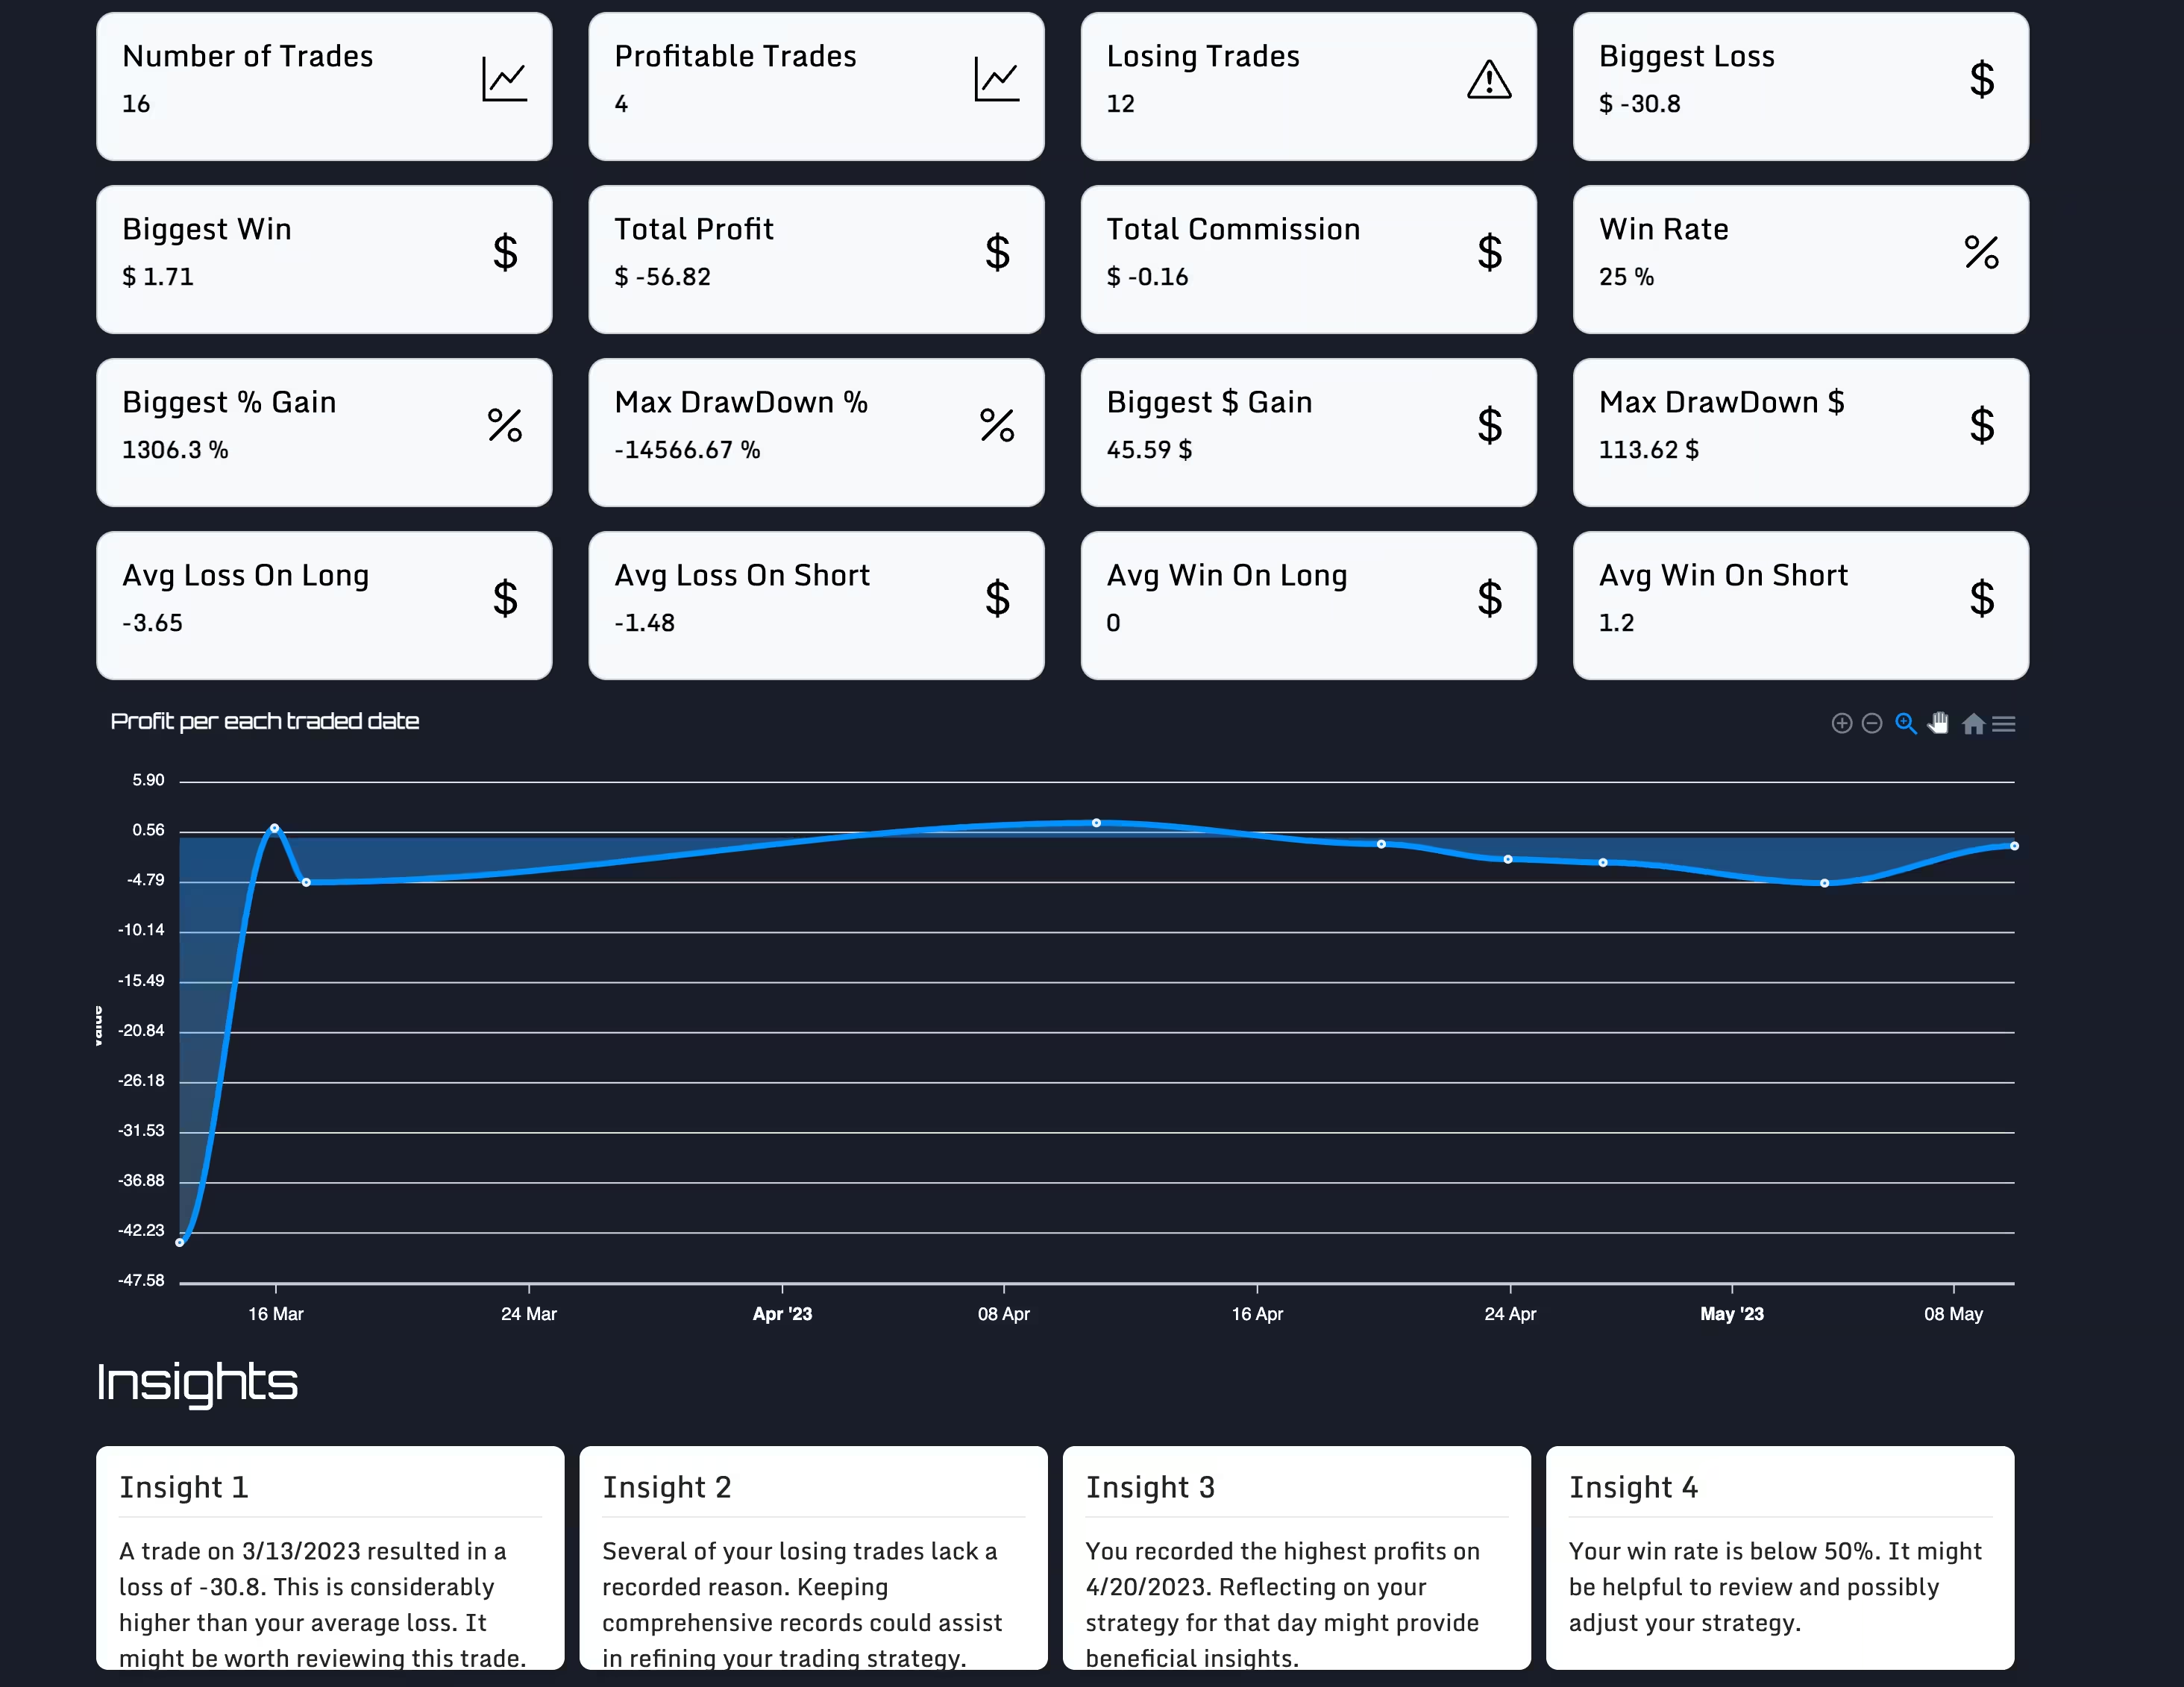
Tabular representation of reports
Representation of hourly notes in Market Journal

Market Journal Overview

Visualize Market Patterns Across Different Timeframes.

Get a panoramic view of the market's behaviors. Whether you're tracking hourly intricacies or monthly tendencies, the Market Journal puts a wealth of data at your fingertips.

  • Time-Specific Breakdown: View the number of fakeouts, liquidity grabs, and move continuations for specific hours like 16h, 12h, 8h or days like Monday, Friday, and even across months.
  • Deep Dive Analysis: Filter and review your notes to spot patterns during exchange opens, or any specific time that interests you.
  • Meaningful Metrics: Understand average pips associated with each metric. See if certain times are more profitable or have specific market behaviors.
  • Graphical Insights: Visualize your data with intuitive graphs. Compare and contrast trends across different timeframes effortlessly.
  • Tabulated Clarity: Besides graphical representations, access a detailed table view. Dive into the specifics of every market movement, hour by hour, day by day, or month by month.

Market Journal's In-Depth Profile

Every Tick and Tock, Visualized.

Every hour, day, or month in the market tells a story. Dive into that story, and unearth hidden patterns, sentiments, and insights with our comprehensive Market Journal Profile.

  • Time-Specific Metrics: Whether it's an eventful hour, a volatile day, or a transformative month, get a thorough breakdown.
  • Pattern & Sentiment Breakdown: Visualize occurrences with pie charts, distinguishing market sentiment and prevalent patterns.
  • Insightful Narratives: Understand the why behind the data. From news impact to hourly behaviors, get context to every market move.
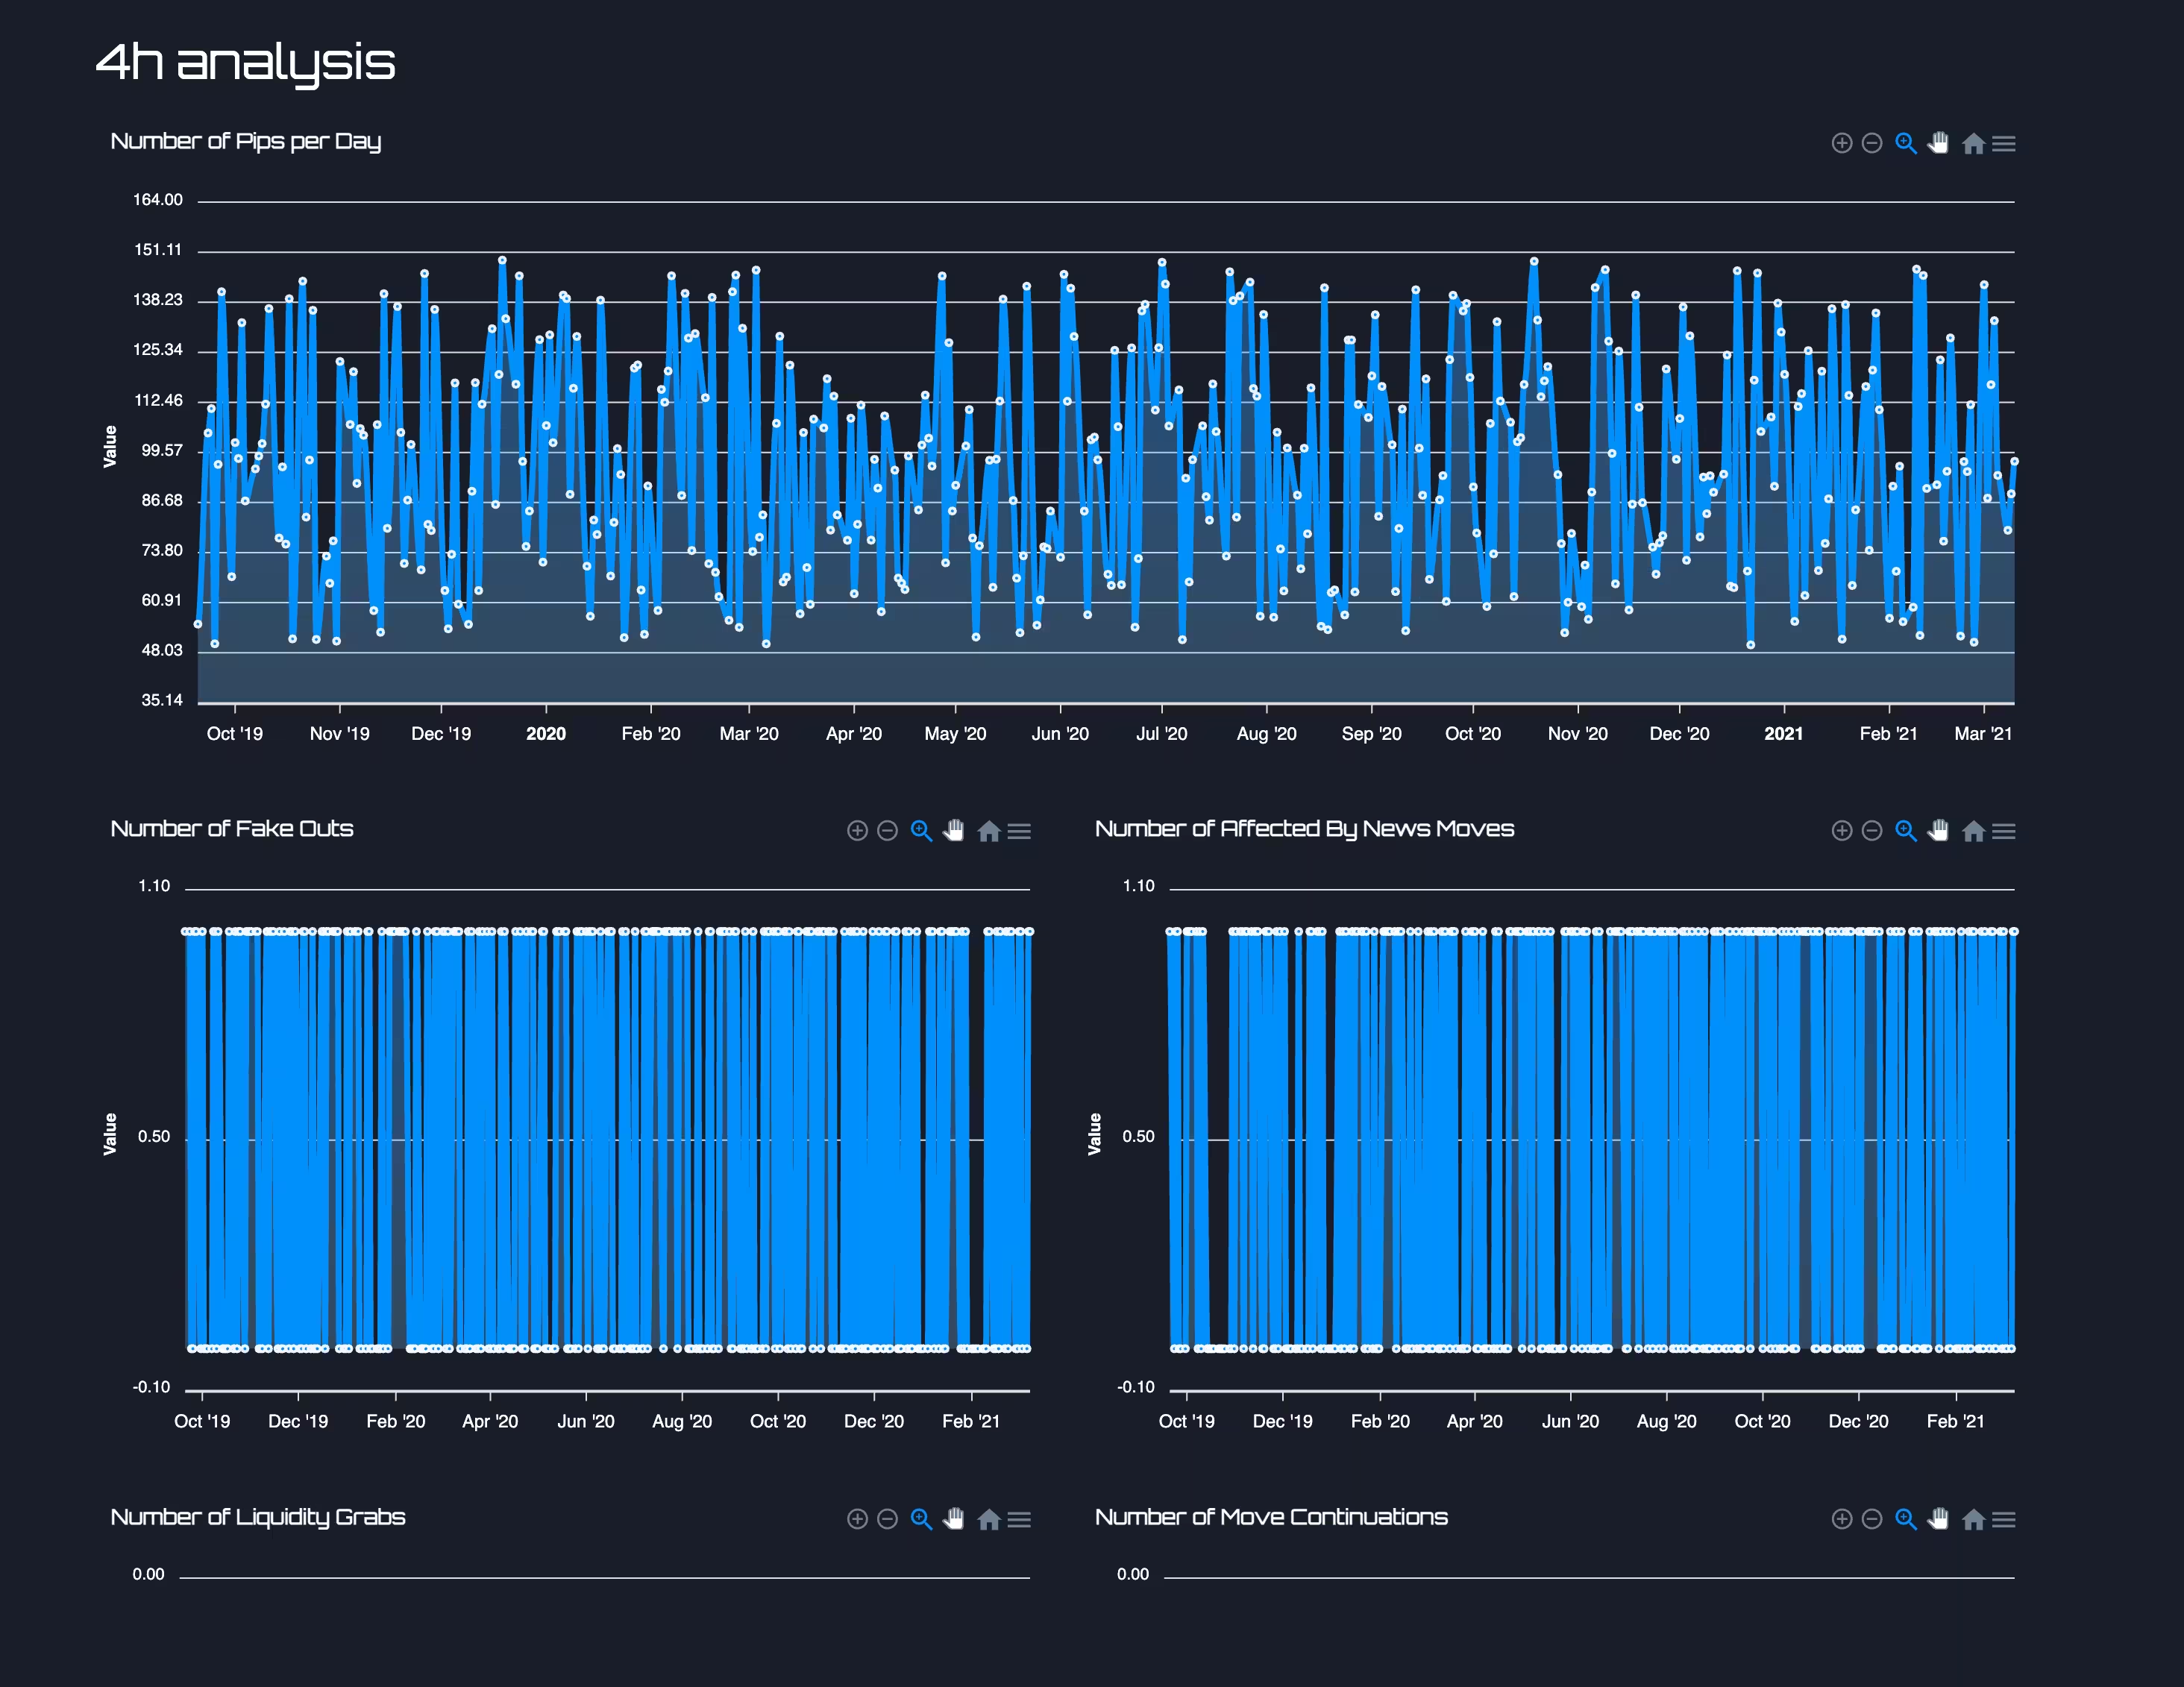
  • Granular Market Movements: Visual representations of market events like fakeouts and move continuations for each timeframe.

Your next market move is hidden within these analyses. Turn insights into actions with an in-depth Market Analysis Profile.
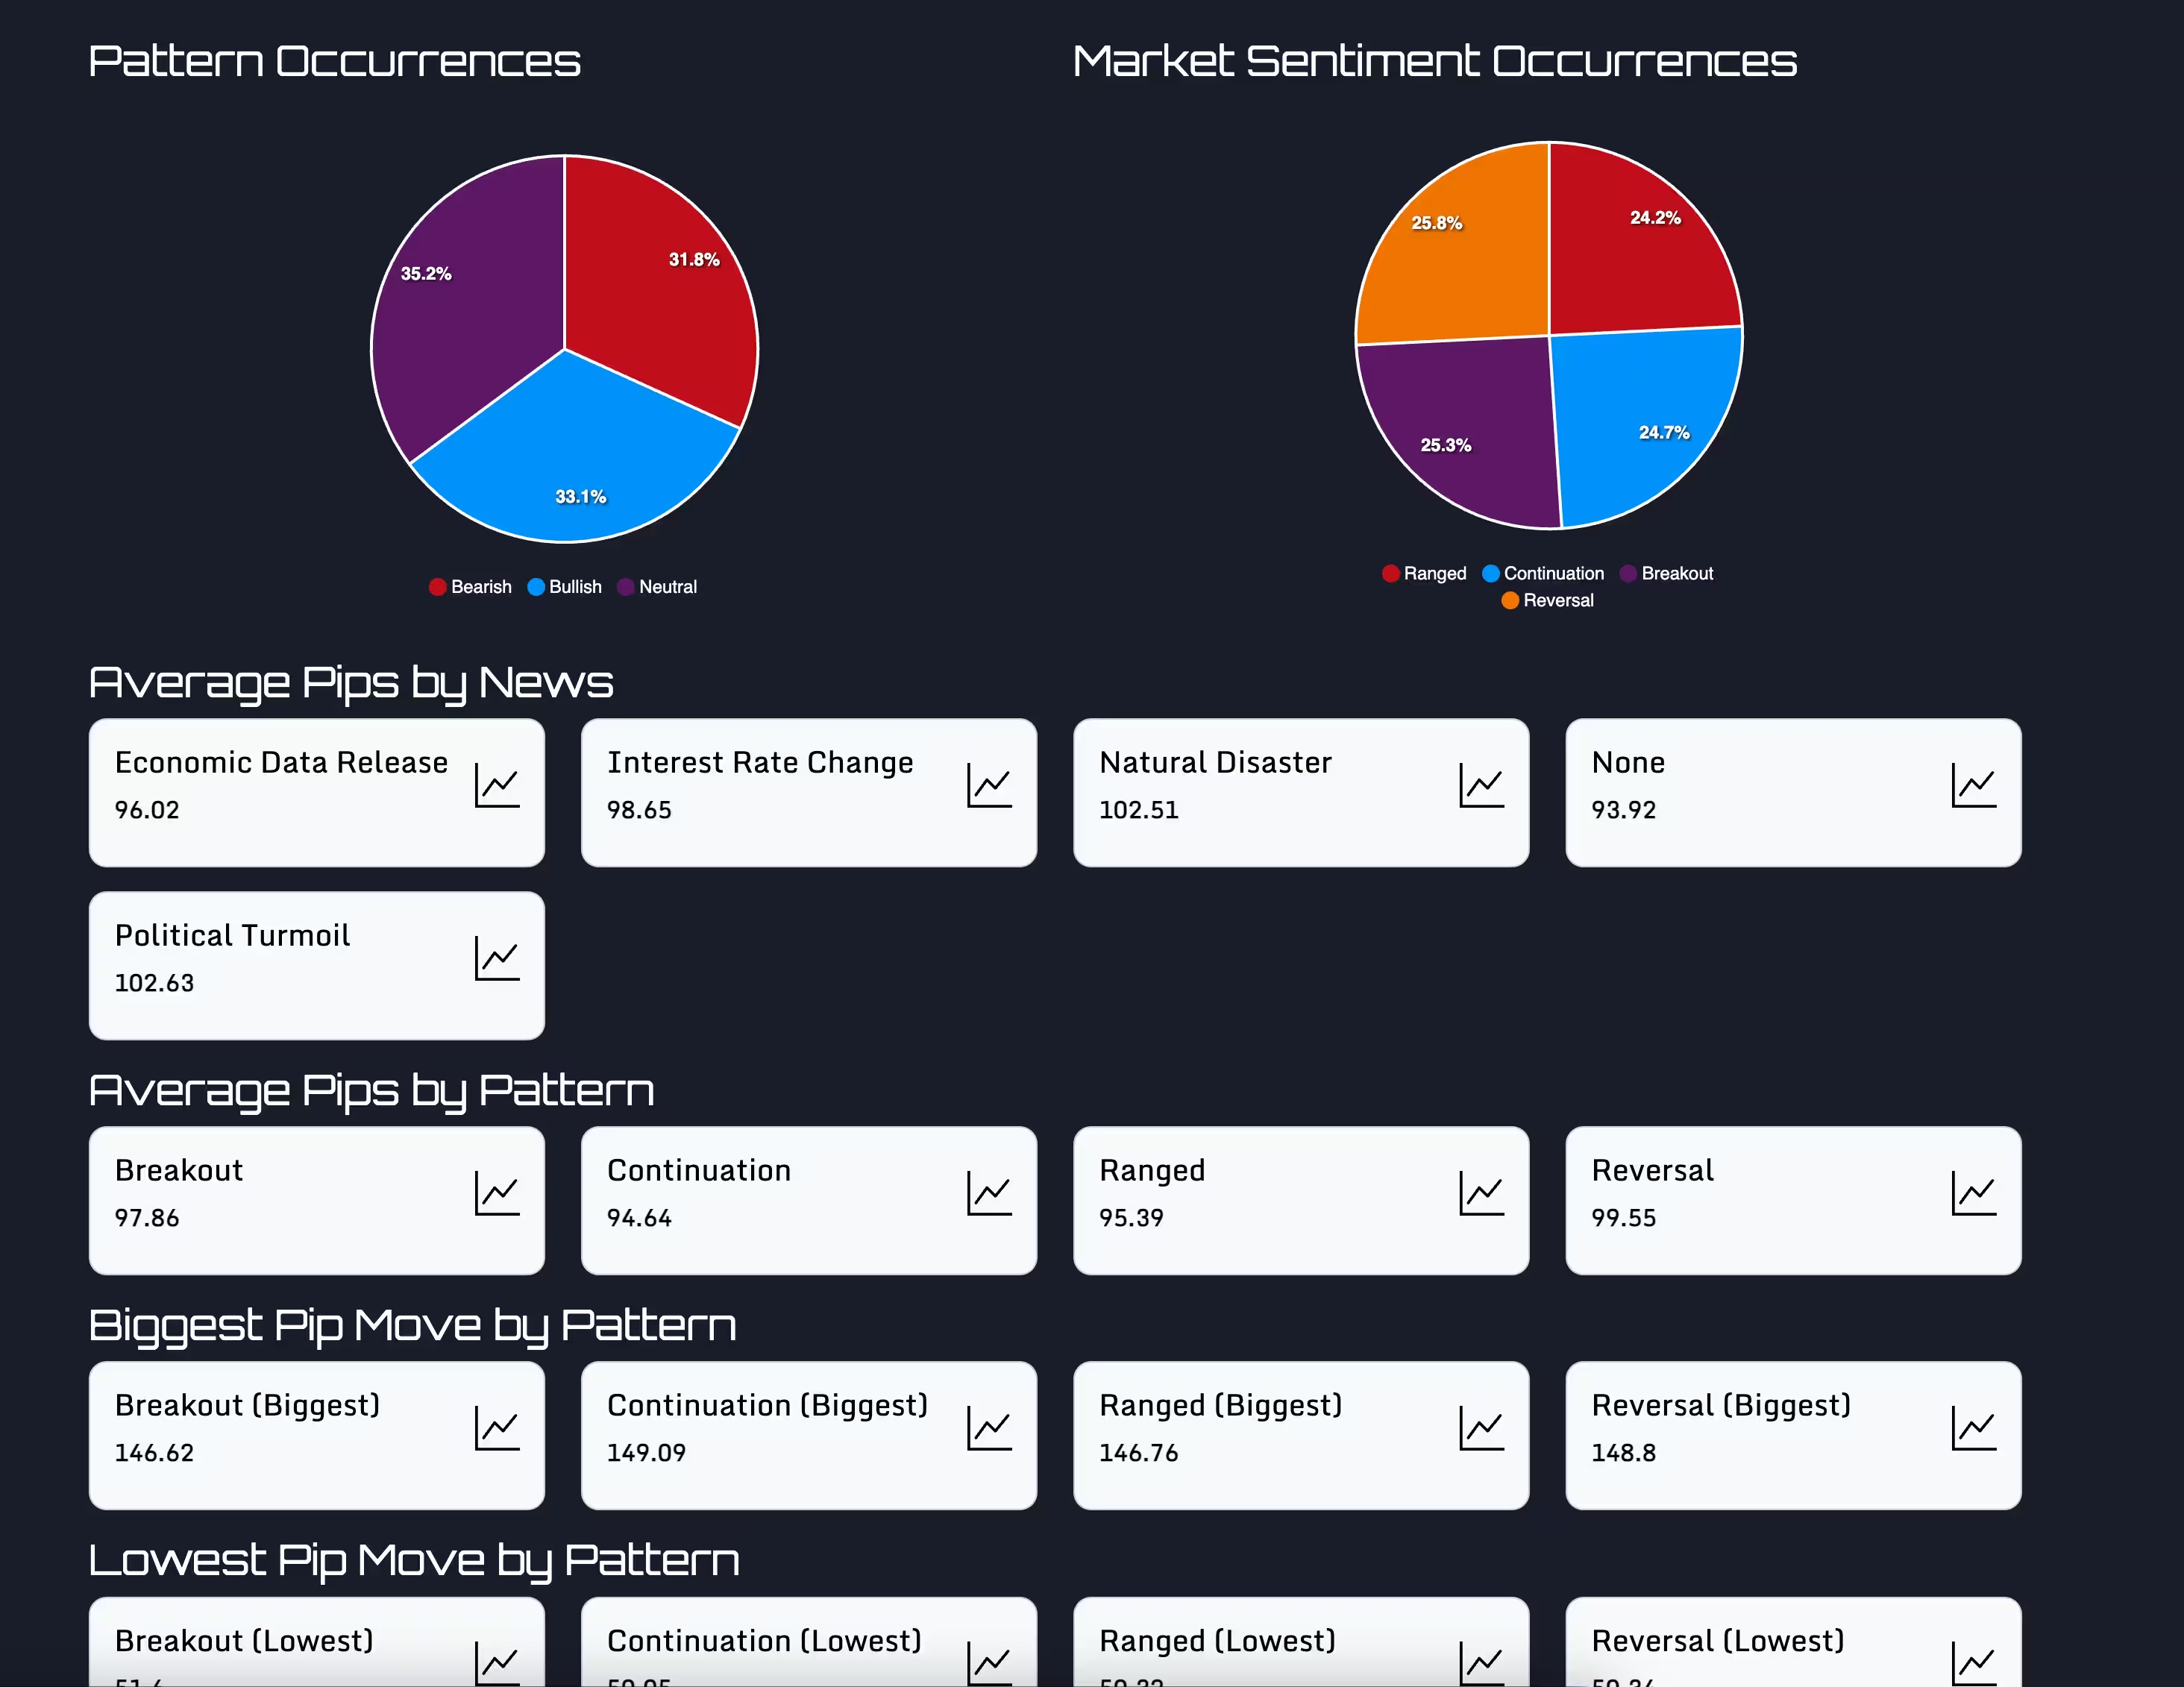
Pie chart representation of market sentiment analysis
Detailed chart representation of market behaviors

Decoding the Market's Pulse

There's a rhythm to the market's madness. As you venture deeper into its patterns and intricacies with our detailed Journal Profiles, every decision becomes more informed, every strategy more potent.